A production-ready guide to AI observability, cost control, and semantic caching — with zero SDK instrumentation.
The Problem: Flying Blind in Production
You’re shipping an AI feature. It works in your Jupyter notebook. It passes your unit tests. You deploy it.
Three weeks later, your finance team forwards an email from OpenAI: your API bill has 3x’d. A customer reports the chatbot started giving weird answers last Tuesday. Your co-founder asks, “Which prompt version are we even running in production right now?”
You check your logs. You see… raw JSON blobs. Scattered across three services. No cost attribution. No prompt versioning. No latency breakdown. Just console.log(response) and a prayer.
Sound familiar? If you’ve been there — or if you’re still there — drop a comment below with your biggest LLM observability headache. Let’s see if Helicone (or the community) can solve it.
What Is Helicone?
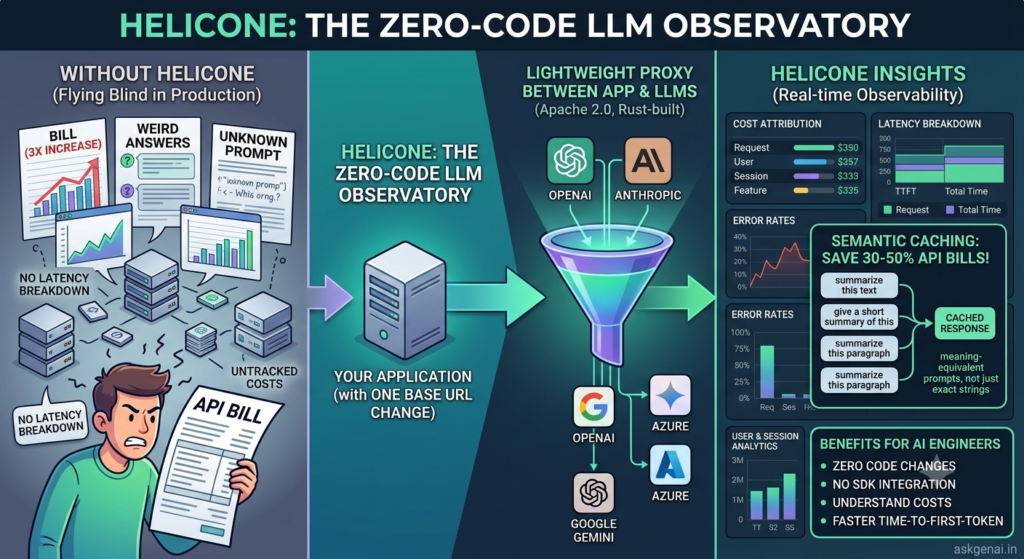
Helicone is an open-source (Apache 2.0) observability platform that sits as a lightweight proxy between your application and any LLM provider — OpenAI, Anthropic, Google Gemini, Azure, and 30+ others.
Built in Rust for performance, it captures every request and response with:
- Full prompt and completion text
- Token usage and cost tracking
- Latency metrics (P50, P95, P99)
- Error rates and status codes
- User and session analytics
The radical part? Zero code changes. You don’t import an SDK. You don’t wrap your API calls. You change one base URL. That’s it.
The 30-Second Setup
Here’s the entire integration:
Before:
Python
import openai

client = openai.OpenAI(api_key="sk-...")
After:
Python
import openai

client = openai.OpenAI(
    base_url="https://oai.helicone.ai/v1",  # ← One change
    default_headers={
        "Helicone-Auth": "Bearer sk-helicone-...",
        "Helicone-Cache-Enabled": "true"       # ← Optional: enable semantic caching
    }
)
That’s the full integration. Your existing client.chat.completions.create() calls work identically. Every call is now logged, tracked, and optionally cached — with <5ms P95 latency overhead.
Quick poll for the readers: How long did your last observability tool take to set up? 30 seconds? 3 hours? 3 days? Tell us in the comments — we need to know if Helicone’s speed is as revolutionary as it sounds, or if we’re just easily impressed.
Why This Matters for AI Engineers
1. Cost Attribution Without the Spreadsheet
Helicone breaks down costs by:
- Request — individual API call cost
- User — per-customer spend (critical for SaaS margin analysis)
- Session — full conversation cost
- Feature — tag requests by product feature (e.g.,
feature=doc-summarizer)
This isn’t vanity metrics. If Customer X is burning $47/day on your AI chatbot while paying you $29/month, you need to know now, not at the end of the quarter.
Real talk: Have you ever discovered a customer or feature was secretly unprofitable because of LLM costs? Share your war story below — or tell us if you think you’re profitable but honestly aren’t sure. No judgment. We’ve all been there.
2. The “Aha!” Feature: Semantic Caching
This is where Helicone becomes a cost optimization engine, not just a logging tool.
Traditional caching checks for exact string matches. Semantic caching detects meaning-equivalent prompts — even if phrased differently.
Table
| Prompt 1 | Prompt 2 | Exact Cache? | Semantic Cache? |
|---|---|---|---|
| “Summarize this contract” | “Summarize this contract” | ✅ Hit | ✅ Hit |
| “Summarize this contract” | “Give me a summary of this contract” | ❌ Miss | ✅ Hit |
| “Explain quantum computing” | “Explain quantum computing simply” | ❌ Miss | ✅ Hit |
For high-traffic applications — customer support bots, documentation Q&A, code assistants — semantic caching alone can reduce API costs by 30–50%.
How it works under the hood:
- Incoming prompts are embedded into a vector space
- Helicone checks cosine similarity against cached embeddings
- If similarity > threshold (configurable, default ~0.95), return cached response
- Cache TTL is configurable (default: 24 hours)
Production tip: Enable caching with the header Helicone-Cache-Enabled: true, but add Helicone-Cache-Bucket-Max-Size: 1000 to prevent cache bloat on high-cardinality prompts.
Question for the builders: What’s your current caching strategy — if you have one? Redis? In-memory? Nothing? And have you ever tried semantic caching, or does “cosine similarity” still sound like a math final you failed? Let us know in the comments. We’re genuinely curious about the state of caching in AI apps right now.
3. Latency Breakdown: Where the Time Goes
Helicone surfaces:
- Time to first token (TTFT) — how long until the model starts responding
- Inter-token latency — gaps between streaming chunks
- Total request time — end-to-end duration
This matters because slow TTFT often indicates provider-side queueing (switch regions or models), while high inter-token latency suggests network or client-side bottlenecks.
Engineering challenge: What’s the slowest TTFT you’ve seen in production? We once saw 8 seconds from a major provider during peak hours. If you’ve got a horror story — or a clever workaround — the comments section is your stage.
4. Session Tracking for Agent Workflows
Modern AI isn’t single-turn chat anymore. It’s multi-step agents with retrievals, tool calls, and reasoning loops.
Helicone groups requests into sessions using the Helicone-Session-Id header:
Python
response = client.chat.completions.create(
    model="gpt-5",
    messages=messages,
    extra_headers={
        "Helicone-Session-Id": "session_abc123",
        "Helicone-Session-Path": "/research/step-1",
        "Helicone-Session-Name": "Research Agent"
    }
)
This gives you a visual timeline of your agent’s execution — which steps are slow, which are expensive, where errors cluster.
Agent builders, assemble: Are you tracking your agent sessions already, or is your debugging strategy still “print statements and hope”? Be honest. We’re building a community here, not a resume.
Architecture: Built for Scale
Helicone isn’t a toy project. Its architecture is designed for billions of requests:
Table
| Layer | Technology | Purpose |
|---|---|---|
| Edge Routing | Cloudflare Workers | Global low-latency proxy entry |
| Analytics DB | ClickHouse | Columnar storage for fast aggregations |
| Streaming | Kafka | Real-time data ingestion |
| Proxy Core | Rust | <5ms overhead, memory-safe |
This stack matters because PostgreSQL-backed alternatives grind to a halt at scale. ClickHouse handles analytical queries (cost rollups, latency percentiles) 100x faster than row-based stores.
Architecture nerds: Rust + ClickHouse + Kafka — is this the dream stack, or overkill for most teams? Would you rather self-host something simpler, or trust the managed proxy? Debate below. We have opinions, but we want yours more.
Pricing: Actually Free to Start
Table
| Tier | Cost | What’s Included |
|---|---|---|
| Hobby | Free | 10,000 requests/month, 1 seat, basic analytics |
| Pro | $79/month | Unlimited seats, alerts, advanced analytics, API access |
| Team | $799/month | 5 organizations, SOC-2 Type II, HIPAA compliance |
| Enterprise | Custom | SAML SSO, on-premise deployment, dedicated support |
The free tier is genuinely usable for production prototypes — not a 7-day trial with a credit card wall. For a startup doing ~300 requests/day, you can run on Hobby indefinitely while you find product-market fit.
Startup founders / indie hackers: What’s your monthly LLM bill right now? And more importantly — do you know why it’s that high? If you’re spending $500+/month and can’t pinpoint where, tell us. We’ll feature the most relatable (or most horrifying) comment in tomorrow’s Langfuse article.
The Honest Trade-offs
Helicone is powerful, but it’s not magic. Know the limits:
Table
| Strength | Limitation |
|---|---|
| ✅ 30-second setup | ❌ Proxy adds a network hop (mitigated by edge deployment) |
| ✅ Zero code changes | ❌ Can’t trace internal application logic (DB calls, custom functions) |
| ✅ Semantic caching | ❌ Cache invalidation is TTL-based, not event-driven |
| ✅ Cost tracking | ❌ Deeper evaluation frameworks require external tools |
The proxy model is request-centric, not span-centric. If you have a complex agent that calls a vector DB, then a weather API, then an LLM, then a calculator tool — Helicone sees the LLM calls clearly, but the DB and API calls are invisible unless you instrument them separately.
For full distributed tracing of multi-service agent chains, you’ll eventually want to complement Helicone with OpenTelemetry or Langfuse (which we’ll cover tomorrow).
Hot take corner: Is the proxy approach a brilliant simplification or a dangerous abstraction? Some engineers love the zero-code setup. Others worry about adding a third-party hop to every LLM call. Where do you stand? Vote with your comment — “Team Proxy” or “Team SDK.”
Production Checklist
Before you deploy Helicone to production, run through this:
- [ ] Enable semantic caching for high-cardinality, repetitive prompts
- [ ] Set cache bucket limits to prevent unbounded growth
- [ ] Tag requests by feature (
Helicone-Property-Feature: summarizer) for cost attribution - [ ] Configure alerts for error rate spikes and latency degradation
- [ ] Set up session tracking for multi-turn conversations and agent workflows
- [ ] Export data to your warehouse via API for long-term trend analysis
- [ ] Monitor cache hit rates — target 60%+ for caching to be worth the overhead
Did we miss anything? If you’ve deployed Helicone (or any LLM observability tool) in production, what would you add to this checklist? The best community tips get added to the article with credit.
Official Resources
Table
| Resource | Link |
|---|---|
| Official Website | helicone.ai |
| GitHub Repository | github.com/Helicone/helicone |
| Documentation | docs.helicone.ai |
| Community Discord | discord.helicone.ai |
| Pricing | helicone.ai/pricing |
The Bottom Line
If you’re running LLMs in production and can’t answer “What did this cost?” or “Which prompt version caused this bug?” in under 10 seconds, you have an observability problem.
Helicone solves it in 30 seconds of setup. No SDK. No instrumentation. No refactoring. Just change a base URL, and suddenly you have cost attribution, latency breakdowns, semantic caching, and session tracking.
It’s not the deepest tracing tool on the market. But it’s the fastest path from “flying blind” to “we know exactly what’s happening.” And sometimes, that’s exactly what you need.
Now it’s your turn. We covered a lot today — but this article is just the starting point. The real value is in the community discussion below.
Drop a comment and tell us:
- What’s your current LLM observability setup? (Console logs? Custom dashboards? Nothing? Be honest.)
- What’s your biggest pain point? (Cost? Latency? Debugging? Version control?)
- Have you tried Helicone, or are you using something else? (Langfuse? Datadog? Homegrown?)