From trace trees to prompt version control — how the #1 open-source LLM observability tool is becoming the GitHub of AI engineering.
The Problem: Debugging AI Is Still a Mess
Yesterday we talked about seeing your LLM calls with Helicone. You changed a base URL, and suddenly you had cost attribution, latency breakdowns, and semantic caching. Game changer.
But now your AI agent is in production. A user reports: “The bot gave me completely wrong legal advice yesterday at 3 PM.”
You open your Helicone dashboard. You see… a list of API calls. Timestamps. Token counts. Costs. But the actual flow? The retrieval step that fetched the wrong document? The tool call that misinterpreted the user intent? The prompt version that subtly changed last Tuesday during your “minor” deployment?
You see data. You don’t see the story.
This is where Langfuse enters. It’s not just observability — it’s the entire AI engineering lifecycle: tracing, prompt management, evaluation, and continuous improvement. And unlike most tools in this space, it’s 100% open-source (MIT license), self-hostable in minutes, and now backed by ClickHouse after their January 2026 acquisition.
What Is Langfuse? (For the Newcomer)
Imagine if GitHub, Datadog, and Jupyter had a baby designed specifically for AI teams. That’s Langfuse.
At its core, Langfuse is an AI Engineering Platform — not just a logging tool. It gives you:
Table
| Capability | What It Means in Plain English |
|---|---|
| Observability & Tracing | See the entire journey of an AI request — not just the final LLM call, but every step: database query, embedding retrieval, tool execution, reasoning loop |
| Prompt Management | Version control for your prompts. Collaborate, iterate, and deploy prompt changes without code deployments |
| Evaluations | Automated testing of your AI outputs — before they reach users |
| Datasets & Benchmarks | Build test sets, run regression tests, measure improvement over time |
| LLM Playground | Debug bad production outputs by replaying them with tweaked prompts — directly from a trace |
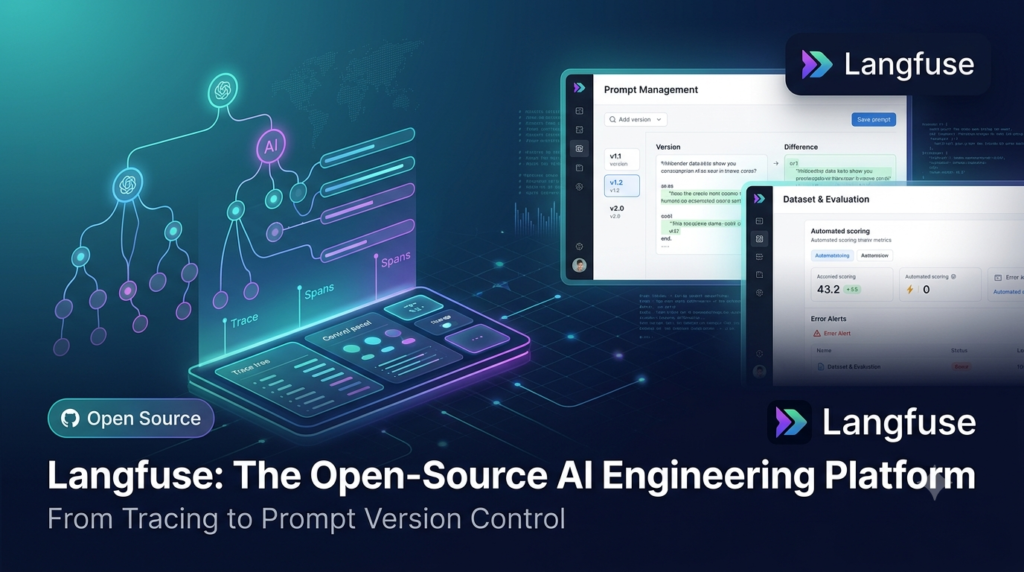
The key difference from simple logging: Langfuse traces spans, not just requests. A span is any unit of work in your system — an LLM call, a vector DB search, a Python function, an API call to Stripe. You see the tree of execution, not just the leaves.
The “Aha!” Moment: Trace-to-Playground Debugging
Here’s the workflow that sells Langfuse to experienced engineers:
Step 1: A user complains about a bad output. You find the trace in Langfuse.
Step 2: You see the full tree:
- User message → Intent classification (0.3s, 150 tokens)
- Retrieval step → Fetched 3 documents from vector DB (0.8s, 2,400 tokens of context)
- LLM generation → Produced wrong answer (2.1s, 890 output tokens)
- Tool call → Attempted calendar booking (failed — wrong date format)
Step 3: You click “Open in Playground” on the LLM generation span. The exact prompt, context documents, model parameters, and temperature are pre-loaded.
Step 4: You tweak the prompt: “Before answering, verify the retrieved documents actually address the user’s question. If not, respond: ‘I don’t have enough information.'”
Step 5: Test in Playground. It works. Save as new prompt version. Deploy.
Total time from bug report to fix: 12 minutes. Without Langfuse? Probably 2 hours of grepping logs, reconstructing context, and praying you reproduced the exact conditions.
New learners: This is what “observability” means in practice — not just “seeing logs,” but understanding causality. Why did this output happen? Which upstream step failed? Langfuse answers that visually.
Experienced engineers: Yes, this is similar to distributed tracing in microservices (Jaeger, Zipkin), but purpose-built for AI workflows where the “services” are LLM calls, retrievals, and prompt templates.
Architecture: Built for Scale and Openness
Langfuse isn’t a black-box SaaS you have to trust. It’s engineered for transparency:
Table
The ClickHouse migration is significant. Before v3, Langfuse used PostgreSQL for trace storage — which works fine until you’re ingesting millions of spans per day. ClickHouse’s columnar storage and vectorized query execution make aggregations (cost rollups, latency percentiles, error rate trends) orders of magnitude faster.
Production-Ready Features (For the Engineers Who’ve Been Burned)
1. Prompt Management: Git for Prompts
Most teams manage prompts in Python strings, JSON files, or (worst case) hardcoded in notebooks. Langfuse offers:
- Version control — every prompt change is tracked with diff view
- Collaborative editing — non-engineers (product, legal, domain experts) can iterate on prompts via UI
- Server-side caching — prompts are fetched at runtime with zero latency penalty (unlike fetching from your own DB)
- A/B testing — deploy different prompt versions to different user segments
- Rollback — new prompt version causing regressions? Revert in 30 seconds without a code deployment
Real-world impact: A legal AI startup we spoke with had their compliance team review prompts directly in Langfuse. Previously, legal changes required a Jira ticket, a sprint, and a deployment. Now? Legal edits, version saved, instant rollout. The engineering team barely knows it happened.
2. Evaluations: Stop Deploying Blindly
Langfuse lets you build evaluation pipelines that run automatically:
Table
| Evaluator Type | Use Case |
|---|---|
| LLM-as-a-Judge | Automated quality scoring (relevance, tone, accuracy) |
| Code Evaluators | Custom Python/TypeScript logic for business-specific checks |
| User Feedback | Thumbs up/down collected in your UI, synced to Langfuse |
| Manual Labeling | Human reviewers score outputs via Langfuse UI |
| Custom Pipelines | Integrate with your existing CI/CD for pre-deployment testing |
The killer workflow: Set up an eval that runs on every trace. If the LLM-as-a-Judge score drops below 0.7, trigger a Slack alert. If it drops below 0.5, automatically create a dataset item for human review. You’re no longer discovering quality regressions from angry tweets — you’re catching them in minutes.
3. Datasets: Continuous Improvement, Not Just Debugging
Langfuse datasets are collections of input/output pairs that serve as:
- Regression tests — “Did our last deployment break these 50 known-good cases?”
- Benchmarks — “How does GPT-5 compare to Claude 4 on our specific tasks?”
- Training data — export curated high-quality examples for fine-tuning
This closes the loop from “debugging in production” to “systematic improvement.”
The Setup: More Than Helicone, Less Than You Think
Langfuse requires SDK instrumentation — unlike Helicone’s 30-second proxy swap. But it’s not painful:
Python (OpenAI SDK):
Python
from langfuse.openai import openai
from langfuse.decorators import observe

client = openai.OpenAI()

@observe()  # ← This decorator traces the entire function
def research_agent(query):
    # Step 1: Retrieve documents
    docs = vector_db.search(query)

    # Step 2: Generate answer
    response = client.chat.completions.create(
        model="gpt-5",
        messages=[...]
    )

    return response.choices[0].message.content
What the @observe() decorator captures:
- Function execution time
- Input and output (automatically, if you return values)
- Child spans (any LLM calls, DB queries, or nested
@observe()functions) - Error traces (if an exception occurs)
JavaScript/TypeScript:
TypeScript
import { Langfuse } from "langfuse";

const langfuse = new Langfuse({
  publicKey: process.env.LANGFUSE_PUBLIC_KEY,
  secretKey: process.env.LANGFUSE_SECRET_KEY,
  baseUrl: "https://cloud.langfuse.com" // or your self-hosted instance
});

// Trace a complex workflow
const trace = langfuse.trace({ name: "support-ticket-analysis" });

const span = trace.span({ name: "intent-classification" });
const classification = await classifyIntent(ticketText);
span.end({ output: classification });

const generation = trace.generation({
  name: "response-generation",
  model: "claude-4",
  prompt: buildPrompt(classification, ticketText)
});
const response = await generateResponse(buildPrompt(classification, ticketText));
generation.end({ output: response });
Key insight: The observe() decorator and manual span API let you trace anything — not just LLM calls. Your vector DB query, your caching layer, your business logic — all visible in the trace tree.
Pricing: Generous Free Tier, Honest Open Source
Table
| Tier | Cost | What’s Included |
|---|---|---|
| Hobby | Free | 50,000 observations/month, basic features |
| Core | $29/month | Higher limits, team collaboration |
| Enterprise | Custom | Self-host license, SAML, priority support |
The open-source advantage: If you outgrow the cloud tier or have strict data residency requirements, docker compose up and you’re running Langfuse in your own VPC. The entire codebase is MIT-licensed on GitHub. No vendor lock-in, no “contact sales” to export your data.
The Honest Trade-offs
Langfuse is powerful, but know the limits:
Table
| Strength | Limitation |
|---|---|
| ✅ Deep trace trees | ❌ Requires SDK instrumentation (more setup than proxy) |
| ✅ Prompt version control | ❌ Prompt UI is powerful but not a full IDE |
| ✅ Open-source & self-hostable | ❌ Self-hosting requires operational overhead (ClickHouse, Redis, S3) |
| ✅ Comprehensive evals | ❌ LLM-as-a-Judge evals add token costs (meta, but real) |
| ✅ Active community (10k+ GitHub stars) | ❌ Rapid feature evolution means occasional breaking changes |
The SDK requirement is the real friction. For legacy codebases where adding decorators is politically difficult, or for teams with strict “no new dependencies” policies, Helicone’s proxy approach wins on speed of adoption. Langfuse wins on depth of insight.
Helicone vs. Langfuse: When to Use What
Table
| Scenario | Use Helicone | Use Langfuse |
|---|---|---|
| Need observability in 30 minutes | ✅ | ❌ |
| Zero code changes required | ✅ | ❌ |
| Semantic caching for cost reduction | ✅ | ❌ |
| Complex multi-step agent tracing | ❌ | ✅ |
| Prompt version control & collaboration | ❌ | ✅ |
| Automated evaluation pipelines | ❌ | ✅ |
| Self-hosting for data sovereignty | ❌ | ✅ |
| Deep debugging of RAG pipelines | ❌ | ✅ |
The power move: Use both. Helicone for quick cost attribution and caching at the proxy layer. Langfuse for deep tracing, prompt management, and evaluation. They integrate well — Helicone can log to Langfuse, or you can use Langfuse’s OpenTelemetry exporter to send spans to Helicone.
Production Checklist
Before deploying Langfuse to production:
- [ ] Instrument core functions with
@observe()decorators - [ ] Set up prompt versioning for all production prompts
- [ ] Configure LLM-as-a-Judge evaluators for critical quality metrics
- [ ] Create baseline datasets from 50+ known-good interactions
- [ ] Set up alerts for eval score drops and error rate spikes
- [ ] Enable user feedback collection (thumbs up/down) synced to Langfuse
- [ ] Self-host or verify cloud tier data residency compliance
- [ ] Export trace data to your warehouse for long-term analysis
Official Resources
Table
| Resource | Link |
|---|---|
| Official Website | langfuse.com |
| GitHub Repository | github.com/langfuse/langfuse |
| Documentation | langfuse.com/docs |
| Self-Hosting Guide | langfuse.com/docs/deployment/local |
| Community Discord | langfuse.com/discord |
| Pricing | langfuse.com/pricing |
The Bottom Line
Helicone showed you what your LLM calls cost. Langfuse shows you why they behave the way they do.
If you’re building anything beyond a simple chatbot — agents, RAG systems, multi-step workflows — you need trace-level visibility. You need prompt version control. You need automated evaluation before your users become your QA team.
Langfuse gives you all of this. Open-source. Self-hostable. Backed by ClickHouse. With a community of 10,000+ developers who’ve collectively figured out most of the hard parts.
It’s not the easiest tool to set up. But it’s the most complete. And in AI engineering, completeness beats convenience every time.
Your Turn: Let’s Build the Ultimate AI Observability Guide
Yesterday’s Helicone article sparked amazing discussions about proxy vs. SDK approaches, caching strategies, and real-world cost savings. Let’s keep that energy going.
Drop a comment below and tell us:
- What’s your current debugging workflow for AI bugs? (Print statements? Sentry? Custom dashboards? Pure panic?)
- Have you tried tracing your AI workflows? What’s the hardest part — instrumentation, visualization, or acting on the data?
- Prompt version control: do you have it? Or are you still finding “mystery prompts” in production that nobody remembers deploying?
- Evaluations: automated, manual, or “we’ll know it’s broken when users complain”? Be honest. No judgment.
The most insightful, funniest, or most painfully relatable comment gets featured in our next article — where we’ll connect Helicone + Langfuse into a unified “Token Saver” production architecture.
Subscribe to askgenai.in and join the conversation. The best AI engineering insights come from the community, not just the docs.